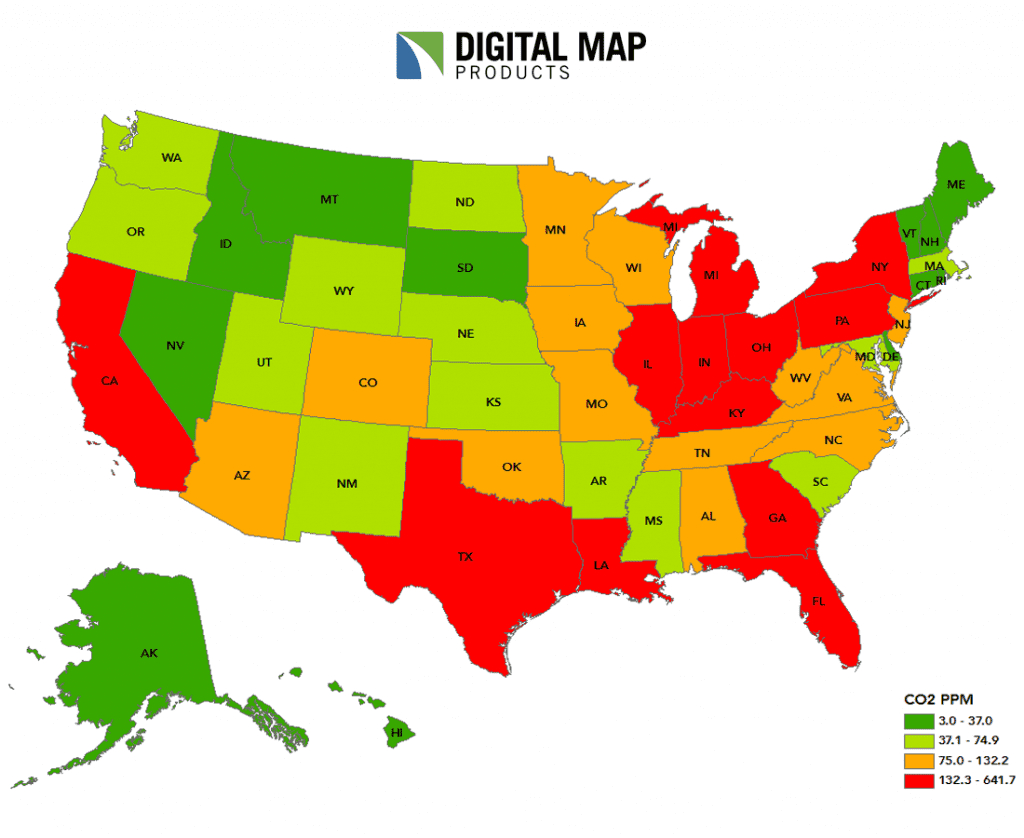
Our topic today: The United States carbon dioxide emission levels (energy-related) by each state.
There’s a lot of dialogue in the world today on political and regulatory fronts related to carbon emissions and climate change. As you probably know, the U.S. decided to pull out of the Paris Agreement (or Paris Climate Accord) and, to no one’s surprise, the issue had a continuing presence on the agenda at this past week’s G-20 meeting. This leaves 195 countries remaining committed to the agreement.
At the same time, the U.S. is about halfway to its emissions reduction target according to an article in the New York Times. And, it turns out that the U.S. action became a motivating force for some states to accelerate their programs already underway. According to the article, many states (California, Washington, New York), cities (Los Angeles, Atlanta, Salt Lake City, Pittsburgh) as well as individual companies (Hewlett Packard, Mars) are all signing on. This suggests that the fight has shifted from the federal level to lower levels of government. Along with academia and industry.
So, as the shift occurs, where is the biggest burden within the U.S. for each state?
Here is an illustration of energy-related carbon dioxide emission levels in the United States. It’s a colorful map that illustrates the level of CO2 emissions during 2000-2014.
As you might guess, red = bad (higher levels) green = good (lower levels).

The data here comes from a 2017 report titled “Energy-Related Carbon Dioxide Emissions at the State Level, 2000-2014” from the U.S. Department of Energy. Specifically, the U.S. Energy Information Administration.
According to the Report:
- Energy-related carbon dioxide (CO2) emissions vary significantly across states, whether considered on an absolute or per capita basis.
- Total state CO2 emissions include those from direct fuel use across all sectors, including residential, commercial, industrial, and transportation, as well as primary fuels consumed for electric generation.
- The overall size of a state, as well as the available fuels, types of businesses, climate, and population density play a role in determining the level of both total and per-capita emissions.
- Additionally, each state’s energy system reflects circumstances specific to that state. For example, some states have abundant hydroelectric supplies, while others contain abundant coal resources.
No matter where you fall on the issue of climate change, it’s important to be aware of the impact we have on our planet – and its impact on us. Today, we covered carbon dioxide emission levels in the United States. At LightBox DMP, we help business and government leaders make smart decisions with the help of location technology and data. This includes hazard data to assess property-level risk from storm surge, wildfire, hurricanes and more.